In short: replacing one employee typically costs between half and twice their annual salary, according to Gallup.
For a mid-sized company with 400 employees and 12% voluntary attrition, a conservative calculation lands at around EUR 1.95 million a year. Most of that cost sits outside the HR budget, which is why it so rarely gets challenged.
Most leadership teams know their attrition rate. Far fewer know what it costs. The salary line of a departing colleague is visible to everyone, but the months of vacancy, the recruiter invoice, the hours spent interviewing, and the slow ramp-up of the replacement are spread across different budgets and different people. Nobody sees the total, so nobody owns it.
This guide gives you a formula you can run against your own numbers in about ten minutes, and a worked example to check your logic against.
Step 1: Calculate your attrition rate
In Germany, the most common approach is the BDA formula, which counts only voluntary departures:
Count voluntary departures separately from retirements and dismissals. Voluntary attrition is the number that says the most about leadership and culture, and it is the one you can influence.
Step 2: Add up what one departure costs
The cost of a single leaver falls into five buckets. The first two are easy to find in your accounts; the last three are where most of the money hides.
| Cost bucket | What it includes | Where to find the number |
|---|---|---|
| Separation | Exit administration, handover time, any remaining leave paid out | HR and payroll |
| Vacancy | Output that does not happen while the role is empty, or overtime and freelancers covering it | Line manager estimate, overtime records |
| Recruitment | Agency fees, job ads, interview hours of managers and team members | HR budget, calendar time |
| Onboarding and ramp-up | Months in which the new hire is paid in full but not yet working at full capacity | Line manager estimate |
| Hidden costs | Lost client relationships, lost know-how, extra load and lower morale in the team left behind | Hard to measure; usually left out, which makes any total conservative |
The cost of attrition for a year is then:
Step 3: A worked example
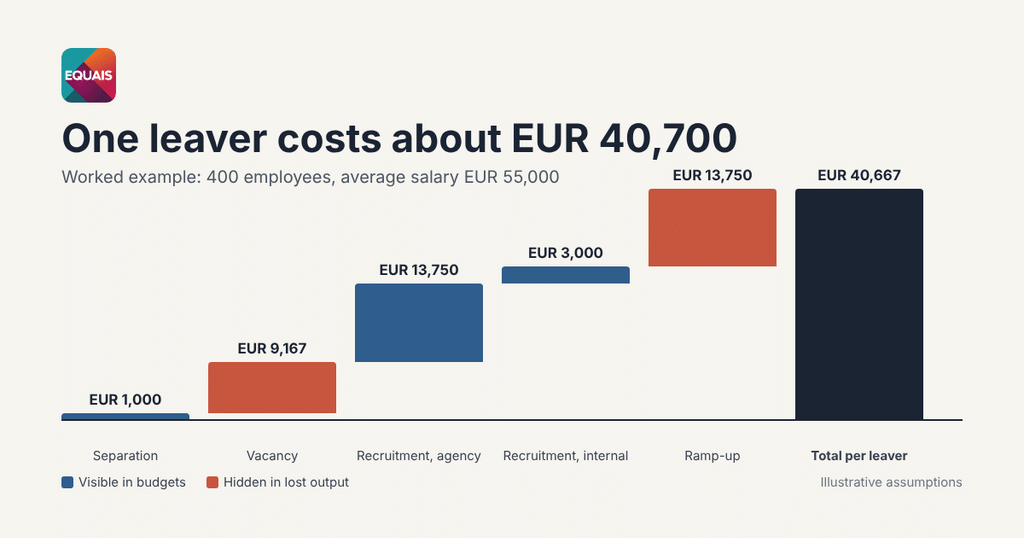
Take a technology company with 400 employees, an average gross salary of EUR 55,000 and a voluntary attrition rate of 12%. That means 48 people leave in a year. The cost assumptions below are illustrative; replace each one with your own figures.
| Cost bucket | Assumption | Cost per leaver |
|---|---|---|
| Separation | Administration and handover | EUR 1,000 |
| Vacancy | Role empty for 2 months, output valued at salary | EUR 9,167 |
| Recruitment, external | Agency fee of 25% of annual salary | EUR 13,750 |
| Recruitment, internal | Interview and selection time of managers and team | EUR 3,000 |
| Ramp-up | 6 months at 50% productivity | EUR 13,750 |
| Total per leaver | About 74% of annual salary | EUR 40,667 |
Multiplied by 48 leavers, the annual cost is about EUR 1.95 million. That sits at the lower end of the Gallup range, which for the same company would run from EUR 1.32 million (half a salary per leaver) to EUR 5.28 million (two salaries per leaver). And it still leaves out the hidden costs entirely.
The more useful number is the marginal one. In this example, every percentage point of attrition equals 4 leavers, or roughly EUR 163,000 a year. That is the figure to put in front of a board when someone asks whether investing in leadership is worth it.
Step 4: Look upstream of the resignation letter
Attrition is the visible end of a longer story. Before people leave, most of them stop giving their best. The Gallup Engagement Index Germany 2025 found that only 10% of employees in Germany feel strongly bound to their employer, and Gallup estimates that disengagement costs the German economy at least EUR 119 billion in lost productivity in 2025.
We call this the activation gap: the distance between what people are capable of and what they actually deliver. Attrition is what happens when that gap stays open long enough.
The lever is closer than most organisations think. Gallup estimates that managers account for at least 70% of the variance in employee engagement across business units. Pay, perks and company-wide programmes matter, but the daily experience of working for a particular manager matters more.
What this means in practice
- Measure it. Run the formula above for your own organisation, and break it down by team. Attrition is rarely spread evenly; it clusters under specific managers.
- Put a euro value on one percentage point. It turns a people discussion into a business decision.
- Invest where the variance is. If managers drive most of the difference in engagement, middle management is where development budget has the highest return.
- Track leading indicators. Engagement, internal mobility and regretted departures move months before the attrition rate does.
Calculate your own number
We run a free 30-minute Culture Evaluation that calculates your attrition cost, a people risk score and the return a leadership programme would need to deliver. Book your Culture Evaluation and leave with a number your board will recognise.